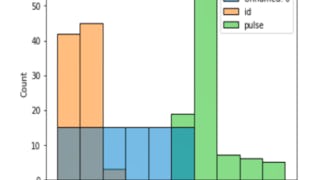
Box Plots
Filter by
SubjectRequired
LanguageRequired
The language used throughout the course, in both instruction and assessments.
Learning ProductRequired
LevelRequired
DurationRequired
SubtitlesRequired
EducatorRequired
Results for "box plots"
 Status: Free Trial
Vanderbilt University
Skills you'll gain: Statistical Methods, Statistical Analysis, Data Visualization, Generative AI, Statistical Hypothesis Testing, Data Presentation, Data Storytelling, Box Plots, Data Analysis, Scatter Plots, Data-Driven Decision-Making, Exploratory Data Analysis, Statistics, Technical Communication, Statistical Inference
Skills you'll gain: Matplotlib, Seaborn, Exploratory Data Analysis, Data Visualization, Pandas (Python Package), Plot (Graphics), Statistical Visualization, Data Visualization Software, Scatter Plots, Data Analysis, Box Plots, Python Programming
 Status: Free Trial
Skills you'll gain: Rmarkdown, Plot (Graphics), Ggplot2, Statistical Visualization, Box Plots, Scatter Plots, Data Visualization, Histogram, Descriptive Statistics, Data Visualization Software, Graphing, R Programming, Data Science
 Status: Free Trial
Rice University
Skills you'll gain: Probability & Statistics, Microsoft Excel, Descriptive Statistics, Business Analytics, Box Plots, Probability Distribution, Data Visualization, Probability, Statistics, Business Mathematics, Spreadsheet Software, Data-Driven Decision-Making, Algebra, Bayesian Statistics, Arithmetic, Case Studies, Statistical Analysis, Quantitative Research, Data Analysis, Correlation Analysis
 Status: Free Trial
University of Minnesota
Skills you'll gain: Health Disparities, Social Determinants Of Health, Health Equity, Maternal Health, Statistical Software, Box Plots, Data Analysis, Health Policy, Child Health, Socioeconomics, Health Informatics, Statistical Hypothesis Testing, Public Health, Data Visualization, Diversity Awareness, Policy Analysis
Most popular
 Status: Free Trial
Rice University
 Status: Free Trial
University of Michigan
 Status: Preview
Universidad Nacional Autónoma de México
 Status: Free Trial
Trending now
- Status: Free Trial
Rice University
 Status: Free Trial
 Status: Free Trial
Macquarie University
 Status: Free Trial
New releases
 Status: Free Trial
 Status: Free Trial
 Status: Free Trial
 Status: Free Trial
