• For Individuals
  • For Businesses
  • For Universities
  • For Governments
Coursera
Log In
Join for Free
Coursera
  • Browse
  • Ggplot 2

Ggplot2 Courses Online

Master ggplot2 for data visualization in R. Learn to create complex and customizable plots to represent data effectively.

Skip to search results

Filter by

Subject
Required
 *

Language
Required
 *

The language used throughout the course, in both instruction and assessments.

Learning Product
Required
 *

Build job-relevant skills in under 2 hours with hands-on tutorials.
Learn from top instructors with graded assignments, videos, and discussion forums.
Get in-depth knowledge of a subject by completing a series of courses and projects.
Earn career credentials from industry leaders that demonstrate your expertise.
Earn career credentials while taking courses that count towards your Master’s degree.

Level
Required
 *

Duration
Required
 *

Skills
Required
 *

Subtitles
Required
 *

Educator
Required
 *

Explore the Ggplot2 Course Catalog

  • C

    Coursera Project Network

    Data Analysis in R: Predictive Analysis with Regression

    Skills you'll gain: Ggplot2, Data Visualization, Regression Analysis, Predictive Analytics, Statistical Modeling, R Programming, Descriptive Statistics, Exploratory Data Analysis, Statistics, Statistical Analysis, Data Analysis

    4.2
    Rating, 4.2 out of 5 stars
    ·
    13 reviews

    Intermediate · Guided Project · Less Than 2 Hours

  • C

    Coursera Project Network

    Simple Parallel Coordinates Plot using d3 js

    Skills you'll gain: Data Visualization, Data Visualization Software, Data Presentation, Interactive Data Visualization, Data Literacy, Visualization (Computer Graphics), Javascript, Data Analysis, Microsoft Visual Studio

    Intermediate · Guided Project · Less Than 2 Hours

  • C

    Coursera Project Network

    Building Statistical Models in R: Linear Regression

    Skills you'll gain: Exploratory Data Analysis, Statistical Modeling, Regression Analysis, Data Visualization, Data Analysis, Statistical Methods, R Programming, Statistical Analysis, Plot (Graphics), Predictive Modeling, Ggplot2

    4.7
    Rating, 4.7 out of 5 stars
    ·
    20 reviews

    Beginner · Guided Project · Less Than 2 Hours

  • C

    Coursera Project Network

    Using Descriptive Statistics to Analyze Data in R

    Skills you'll gain: Descriptive Statistics, R Programming, Statistical Reporting, Data Quality, Data Cleansing, Statistics, Data Manipulation, Data Analysis Software, Statistical Analysis, Data Import/Export

    4.6
    Rating, 4.6 out of 5 stars
    ·
    93 reviews

    Beginner · Guided Project · Less Than 2 Hours

  • Status: Free Trial
    Free Trial
    D

    Duke University

    Data Tidying and Importing with R

    Skills you'll gain: Web Scraping, Data Ethics, Data Transformation, Tidyverse (R Package), Data Wrangling, Data Cleansing, Data Manipulation, Data Collection, Data Capture, Data Pipelines, Data Integration, Personally Identifiable Information, R Programming, Exploratory Data Analysis, Information Privacy, Statistical Programming

    5
    Rating, 5 out of 5 stars
    ·
    9 reviews

    Beginner · Course · 1 - 4 Weeks

  • C

    Coursera Project Network

    Data Manipulation with dplyr in R

    Skills you'll gain: Data Manipulation, Tidyverse (R Package), Data Wrangling, Data Analysis, R Programming, Exploratory Data Analysis, Statistical Analysis

    4.6
    Rating, 4.6 out of 5 stars
    ·
    21 reviews

    Beginner · Guided Project · Less Than 2 Hours

  • Status: New
    New
    Status: Free Trial
    Free Trial
    E

    EDUCBA

    Advanced Matplotlib: Design & Customize Visualizations

    Skills you'll gain: Matplotlib, Plot (Graphics), Scientific Visualization, Data Visualization Software, Data Presentation

    Mixed · Course · 1 - 4 Weeks

  • Status: New
    New
    Status: Preview
    Preview
    O

    O.P. Jindal Global University

    Statistical Methods and Data Analysis

    Skills you'll gain: Sampling (Statistics), Statistical Analysis, Probability Distribution, Statistical Hypothesis Testing, Descriptive Statistics, Statistical Methods, Correlation Analysis, Regression Analysis, R (Software), R Programming, Statistical Modeling, Statistical Inference, Probability, Big Data, Decision Tree Learning

    Build toward a degree

    Mixed · Course · 1 - 3 Months

  • C

    Coursera Project Network

    Create Charts and Dashboard using Google Sheets

    Skills you'll gain: Dashboard, Google Sheets, Spreadsheet Software, Pivot Tables And Charts, Data Visualization, Data Visualization Software, Data Presentation, Interactive Data Visualization, Excel Formulas, Data Analysis, Data Manipulation

    4.6
    Rating, 4.6 out of 5 stars
    ·
    639 reviews

    Beginner · Guided Project · Less Than 2 Hours

  • Status: Free Trial
    Free Trial
    D

    Duke University

    Introduction to Probability and Data with R

    Skills you'll gain: Sampling (Statistics), Exploratory Data Analysis, R (Software), Statistical Inference, Probability Distribution, Bayesian Statistics, R Programming, Data Analysis, Probability, Statistics, Statistical Analysis, Descriptive Statistics

    4.7
    Rating, 4.7 out of 5 stars
    ·
    5.8K reviews

    Beginner · Course · 1 - 3 Months

  • Status: Preview
    Preview
    U

    University of Illinois Urbana-Champaign

    Visualization for Data Journalism

    Skills you'll gain: Data Visualization, Interactive Data Visualization, Data Presentation, Infographics, Data Visualization Software, Data Storytelling, Plotly, Matplotlib, Journalism, Graphing, Data Literacy, Color Theory, Data Manipulation, Design Elements And Principles, Data Analysis

    4.5
    Rating, 4.5 out of 5 stars
    ·
    68 reviews

    Beginner · Course · 1 - 3 Months

  • Status: New
    New
    Status: Preview
    Preview
    C

    Coursera

    Explore and Visualize Data the Python Way

    Skills you'll gain: Data Storytelling, Data Presentation, Plotly, Matplotlib, Exploratory Data Analysis, Plot (Graphics), Data Visualization, Interactive Data Visualization, Data Visualization Software, Statistical Visualization, Seaborn, Data Analysis, Box Plots, Descriptive Statistics, Jupyter, Data Science, Anomaly Detection, Python Programming, GitHub

    Beginner · Course · 1 - 4 Weeks

Ggplot2 learners also search

Analytics
Business Intelligence
Business Analytics
Business Intelligence Projects
Digital Analytics
Web Analytics
Financial Analytics
Social Media Analytics
1…91011…12

In summary, here are 10 of our most popular ggplot2 courses

  • Data Analysis in R: Predictive Analysis with Regression: Coursera Project Network
  • Simple Parallel Coordinates Plot using d3 js: Coursera Project Network
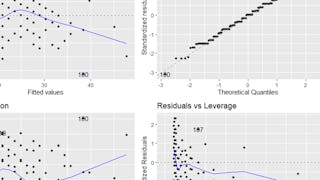
  • Building Statistical Models in R: Linear Regression: Coursera Project Network
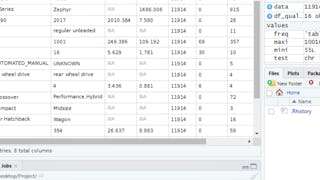
  • Using Descriptive Statistics to Analyze Data in R: Coursera Project Network
  • Data Tidying and Importing with R: Duke University
  • Data Manipulation with dplyr in R: Coursera Project Network
  • Advanced Matplotlib: Design & Customize Visualizations: EDUCBA
  • Statistical Methods and Data Analysis : O.P. Jindal Global University
  • Create Charts and Dashboard using Google Sheets: Coursera Project Network
  • Introduction to Probability and Data with R: Duke University

Other topics to explore

Arts and Humanities
338 courses
Business
1095 courses
Computer Science
668 courses
Data Science
425 courses
Information Technology
145 courses
Health
471 courses
Math and Logic
70 courses
Personal Development
137 courses
Physical Science and Engineering
413 courses
Social Sciences
401 courses
Language Learning
150 courses

Coursera Footer

Skills

  • Artificial Intelligence (AI)
  • Cybersecurity
  • Data Analytics
  • Digital Marketing
  • English Speaking
  • Generative AI (GenAI)
  • Microsoft Excel
  • Microsoft Power BI
  • Project Management
  • Python

Certificates & Programs

  • Google Cybersecurity Certificate
  • Google Data Analytics Certificate
  • Google IT Support Certificate
  • Google Project Management Certificate
  • Google UX Design Certificate
  • IBM Data Analyst Certificate
  • IBM Data Science Certificate
  • Machine Learning Certificate
  • Microsoft Power BI Data Analyst Certificate
  • UI / UX Design Certificate

Industries & Careers

  • Business
  • Computer Science
  • Data Science
  • Education & Teaching
  • Engineering
  • Finance
  • Healthcare
  • Human Resources (HR)
  • Information Technology (IT)
  • Marketing

Career Resources

  • Career Aptitude Test
  • Examples of Strengths and Weaknesses for Job Interviews
  • High-Income Skills to Learn
  • How Does Cryptocurrency Work?
  • How to Highlight Duplicates in Google Sheets
  • How to Learn Artificial Intelligence
  • Popular Cybersecurity Certifications
  • Preparing for the PMP Certification
  • Signs You Will Get the Job After an Interview
  • What Is Artificial Intelligence?

Coursera

  • About
  • What We Offer
  • Leadership
  • Careers
  • Catalog
  • Coursera Plus
  • Professional Certificates
  • MasterTrack® Certificates
  • Degrees
  • For Enterprise
  • For Government
  • For Campus
  • Become a Partner
  • Social Impact
  • Free Courses
  • Share your Coursera learning story

Community

  • Learners
  • Partners
  • Beta Testers
  • Blog
  • The Coursera Podcast
  • Tech Blog

More

  • Press
  • Investors
  • Terms
  • Privacy
  • Help
  • Accessibility
  • Contact
  • Articles
  • Directory
  • Affiliates
  • Modern Slavery Statement
  • Manage Cookie Preferences
Learn Anywhere
Download on the App Store
Get it on Google Play
Logo of Certified B Corporation
© 2025 Coursera Inc. All rights reserved.
  • Coursera Facebook
  • Coursera Linkedin
  • Coursera Twitter
  • Coursera YouTube
  • Coursera Instagram
  • Coursera TikTok